Crypto market reading for Windows

See the market through 15,000+ hours of trading experience.

Trendium reads seven timeframes at once and explains, in plain words, which way pressure is leaning, who is driving the move, and where the risk is — so you understand the market before you act.

For Windows 10 and 11 · Educational tool, not financial advice

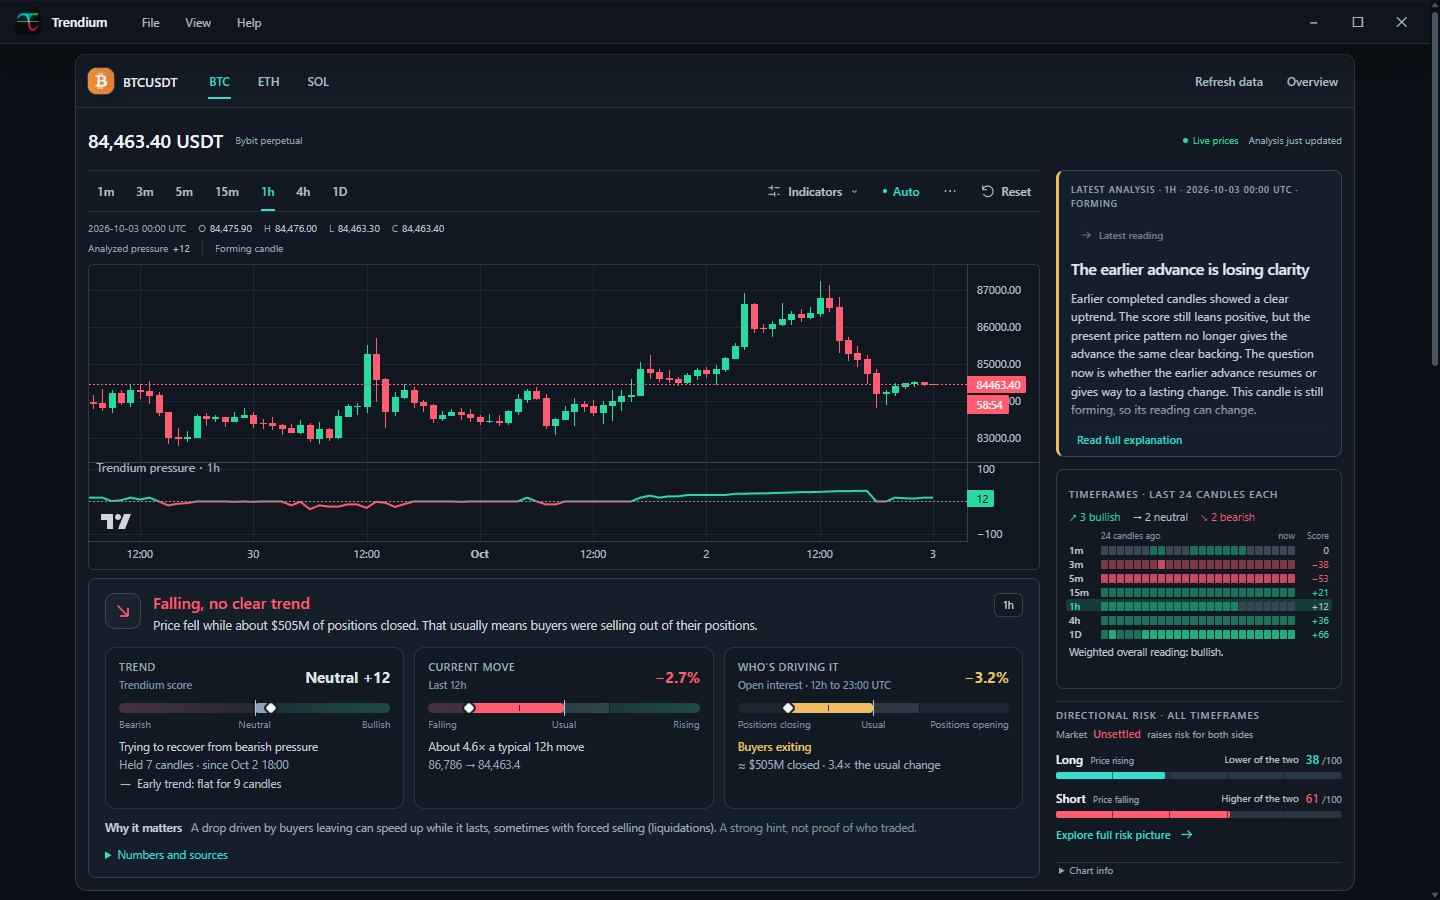
Trendium showing the Bitcoin chart with the Trendium score, the current move, who is driving it, the timeframe ribbon and directional risk.

Everything you need to read the trend

Built for beginners who want to learn and for experienced traders who want the full picture at a glance.

Market overview

Seven timeframes in one picture

From 1 minute to 1 day, every timeframe gets its own reading — then Trendium combines them into one score, giving the longer timeframes more weight.

  • See at a glance where the timeframes agree and where they pull apart
  • Follow your own watchlist of markets
  • Live prices, with the reading updated as candles close
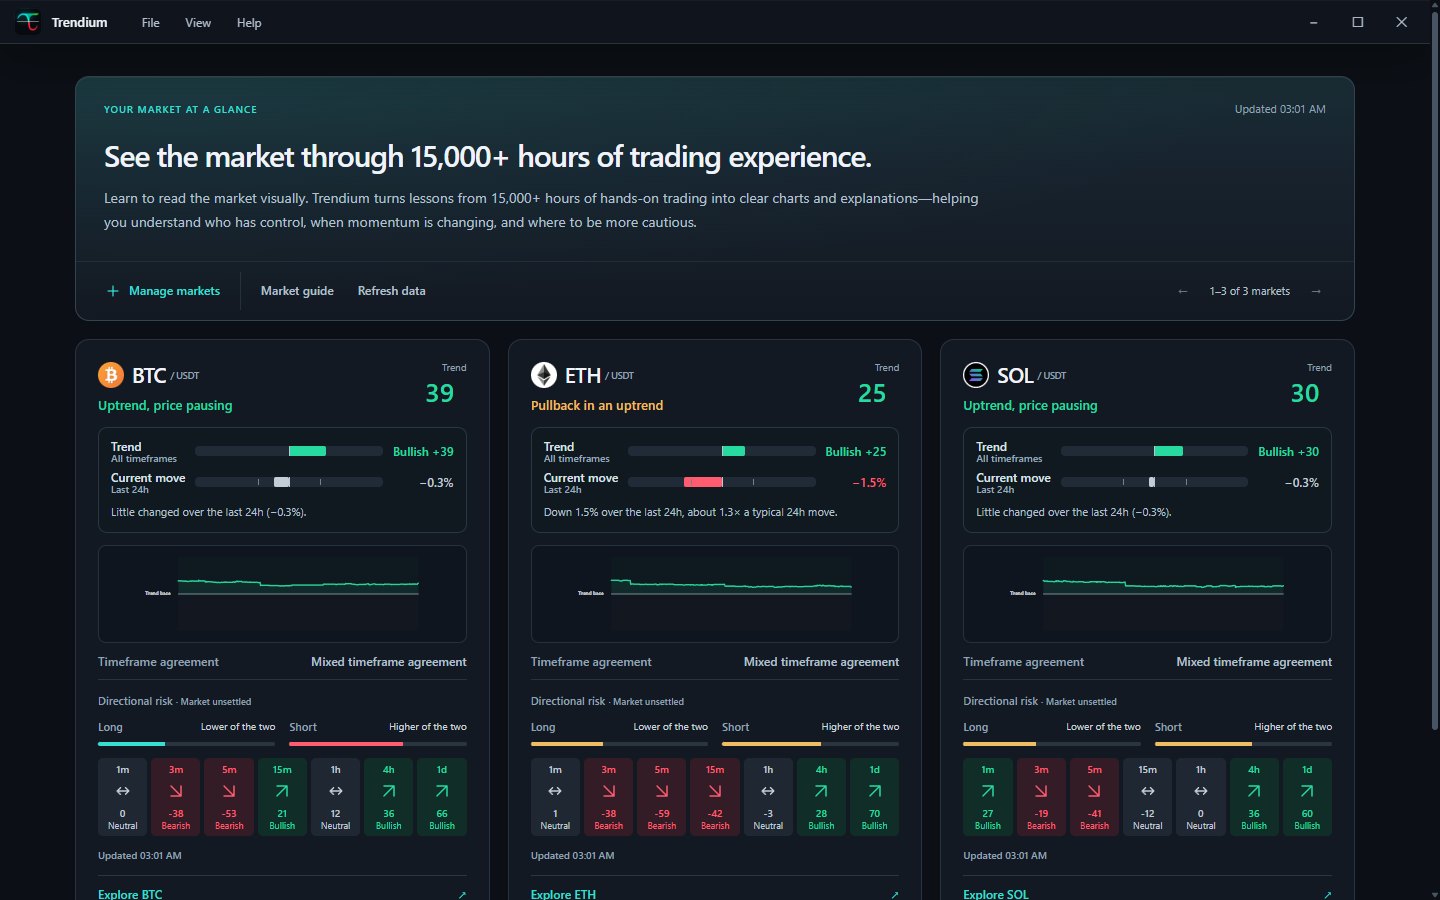
The market overview with Bitcoin, Ethereum and Solana, each showing its trend, current move, timeframe agreement and directional risk.
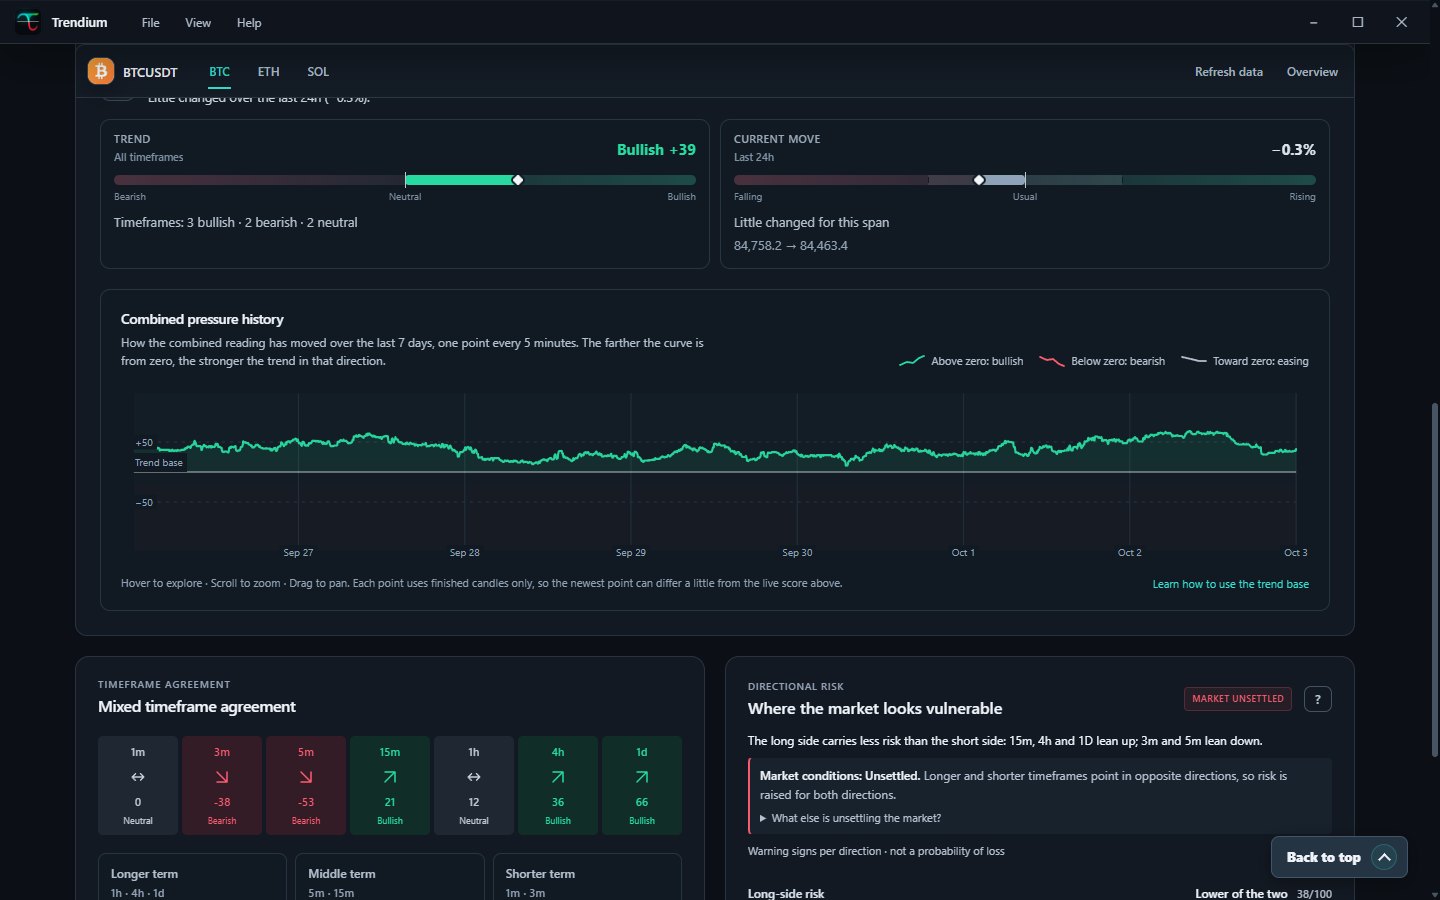
Combined history

A week of trend, at a glance

The combined pressure history shows how the reading across all seven timeframes has moved over the last 7 days, so you can see when the trend strengthened, faded or turned.

  • Above zero: bullish
  • Below zero: bearish
  • Toward zero: easing
The combined pressure history over the last 7 days, with dates along the bottom.
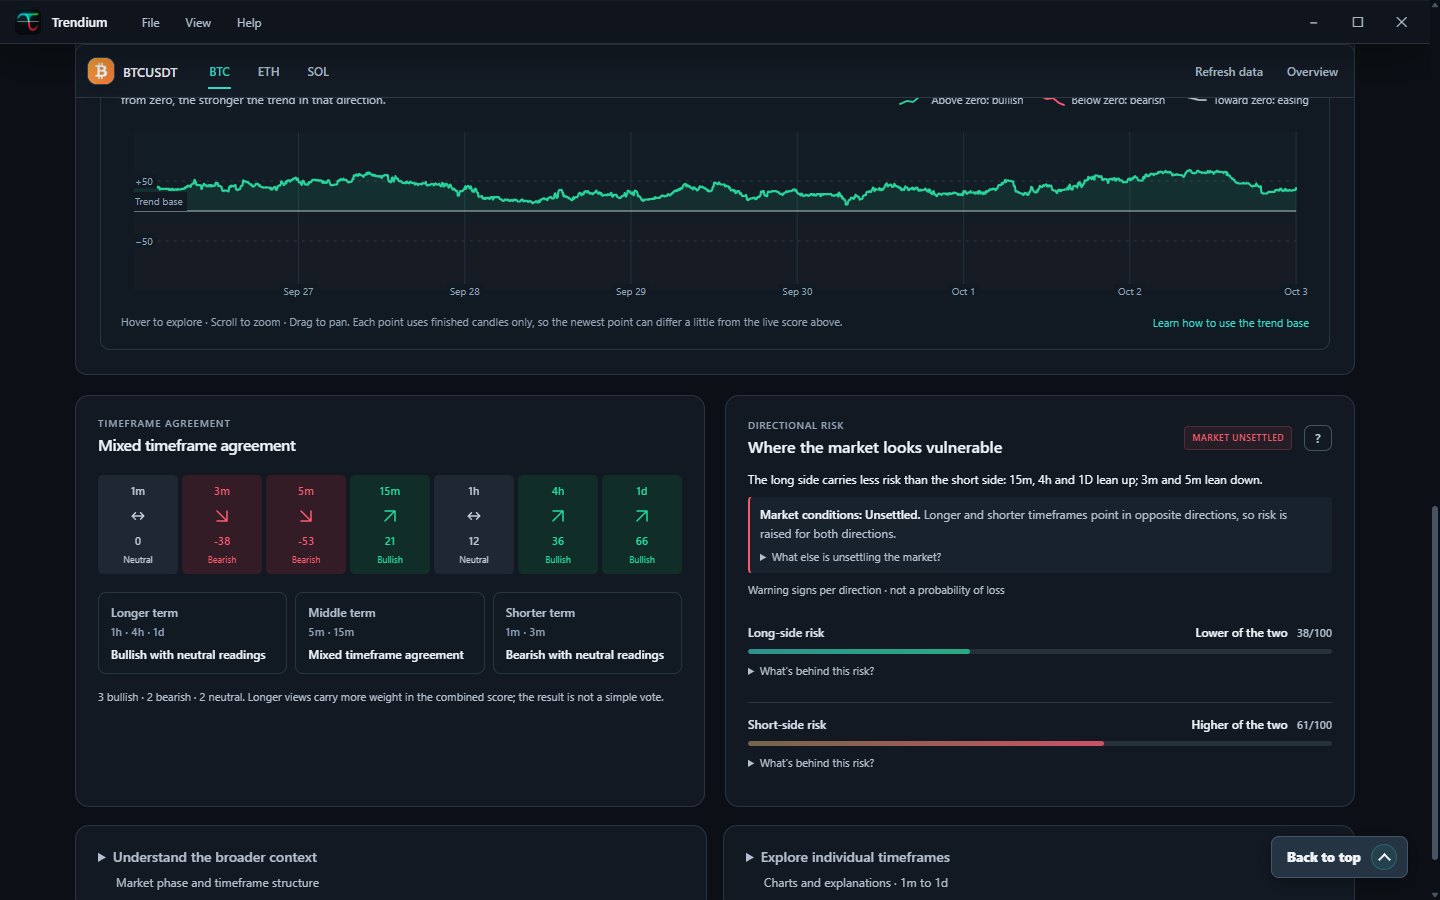
Directional risk

A strong trend can still be a risky trade

Trendium shows the warning signs for buying and for selling side by side — like going against the bigger trend or chasing a stretched move — and says when the whole market is unsettled.

  • Long and short compared: lower of the two, similar, or higher
  • Plain reasons behind every reading
  • Warning signs, not a probability of loss
Timeframe agreement tiles and the directional risk panel comparing long-side and short-side risk.
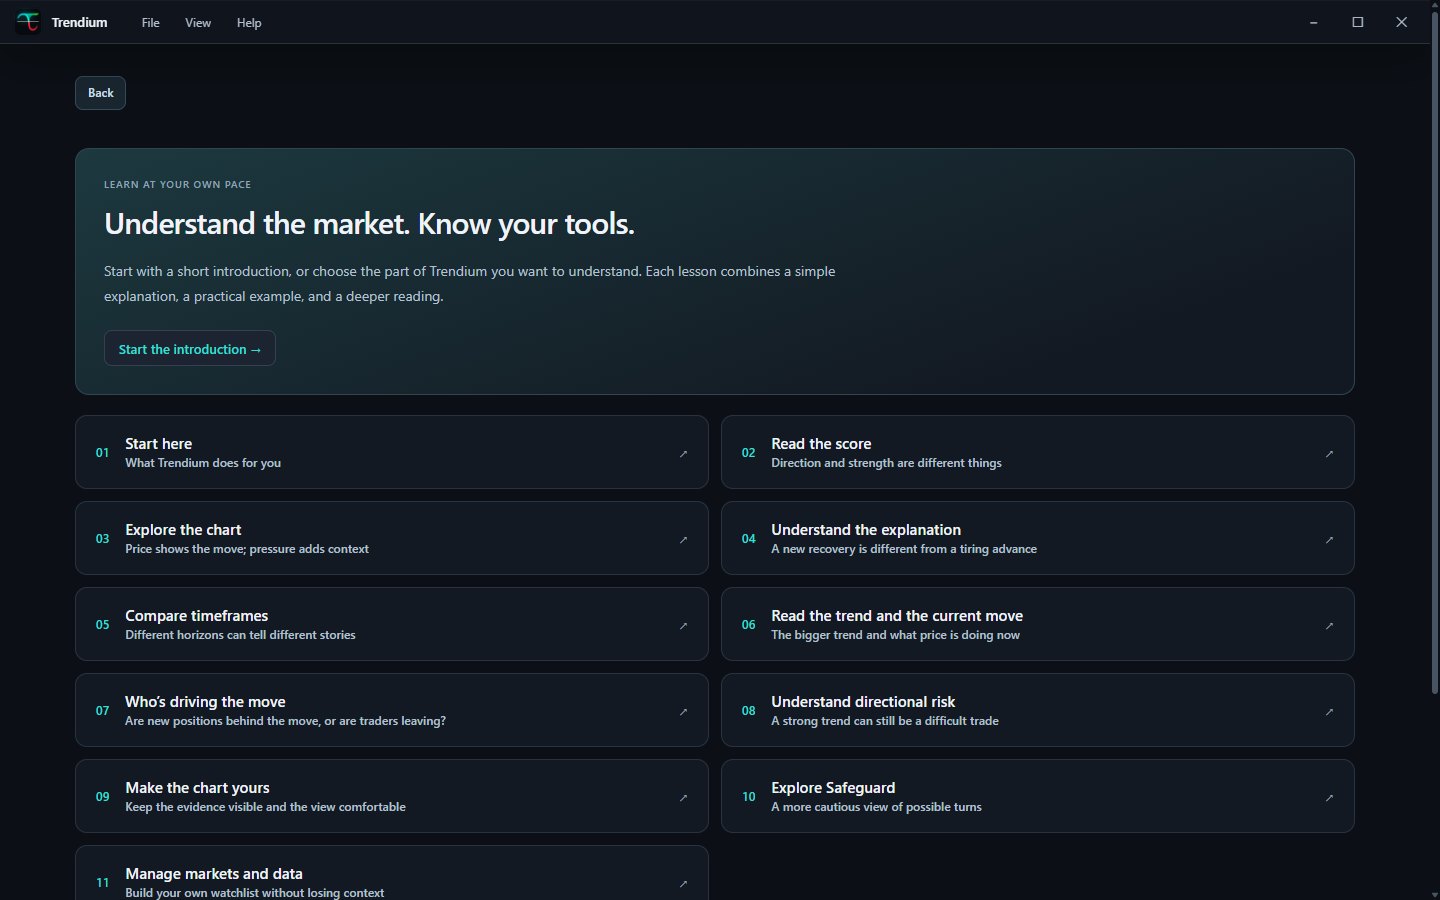
Learn as you go

Understand every reading

Eleven short lessons explain the score, the chart, timeframes, who is driving the move and risk — each with a simple explanation, a practical example and a deeper reading when you want it.

The learning hub with eleven lessons, from Start here to Manage markets and data.

More context, in plain words

Every number comes with an explanation of what it means and what to watch next.

The Trendium score

Which way pressure leans on each timeframe, how strong it is, and how long it has held.

Who's driving the move

Open interest from Binance, Bybit and OKX shows whether new buyers or sellers are behind a move, or positions are closing — with dollar amounts.

Early trend

A faster reading that turns sooner than the main score, so you can spot a possible change early.

Key levels

Optional swing levels mark the nearest high and low that price hasn't broken, plus the averages Trendium reads.

Current move

Compares the latest move with a typical one for the same span, so you know whether it is ordinary or unusual.

Private by design

Calculations run on your computer. No exchange account, API keys or wallet access needed.

Read the market with more context

Get Trendium from the Microsoft Store, or download the Windows installer directly.